America’s Best Places for Bikes: Our New System Rates 480 U.S. Cities
By: Michael Andersen, PlacesForBikes staff writer
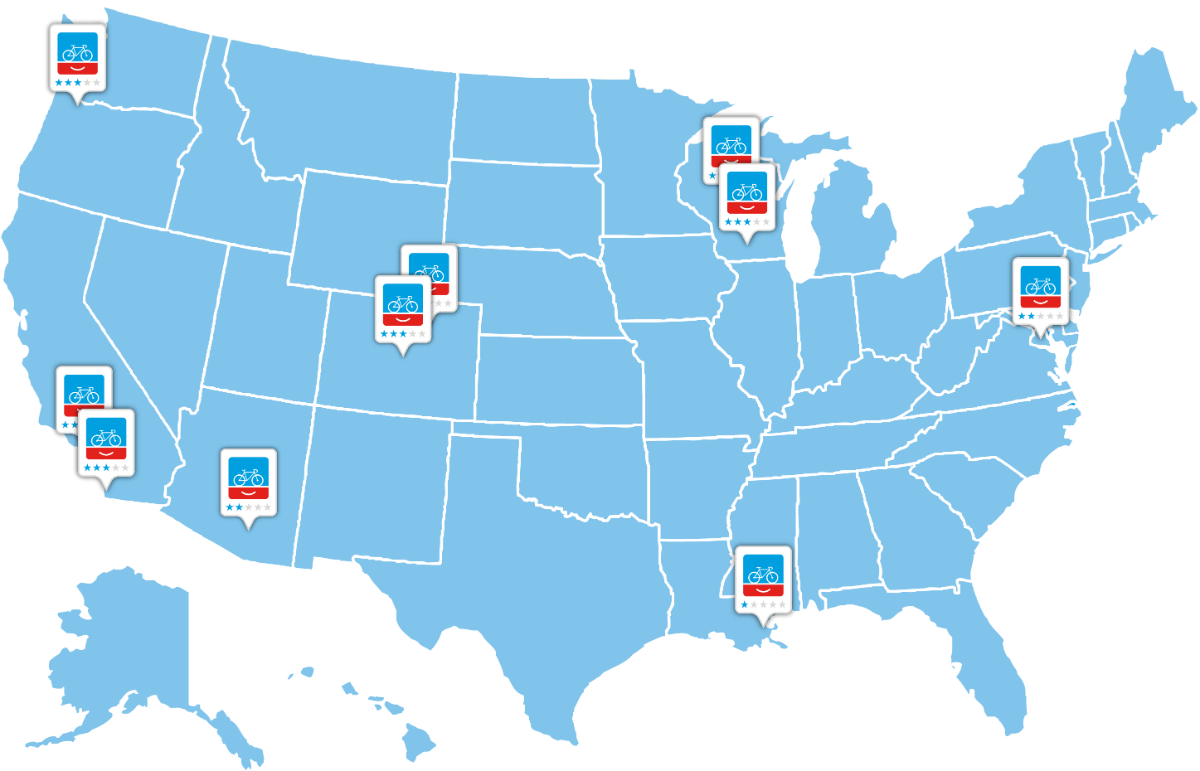
The future of American bicycling is already here. It’s just that some cities are living it right now, and some aren’t yet.
When people ride bikes, great things happen: they get happier, healthier, richer, more equal and more connected to their communities.
Great things happen to those communities, too, even for people who never bike: less pollution, higher-capacity roadways, better mass transit, lower health care premiums, and local economies that have more money to invest in themselves.
Good news! In the last 20 years, infrastructural and cultural changes have made biking much, much better in parts of some U.S. cities. And in those places — in some cities they’re just a few neighborhoods — people have responded. Biking rates have boomed.
Today, PeopleForBikes launches a new system for identifying those places so we can all learn from their success.
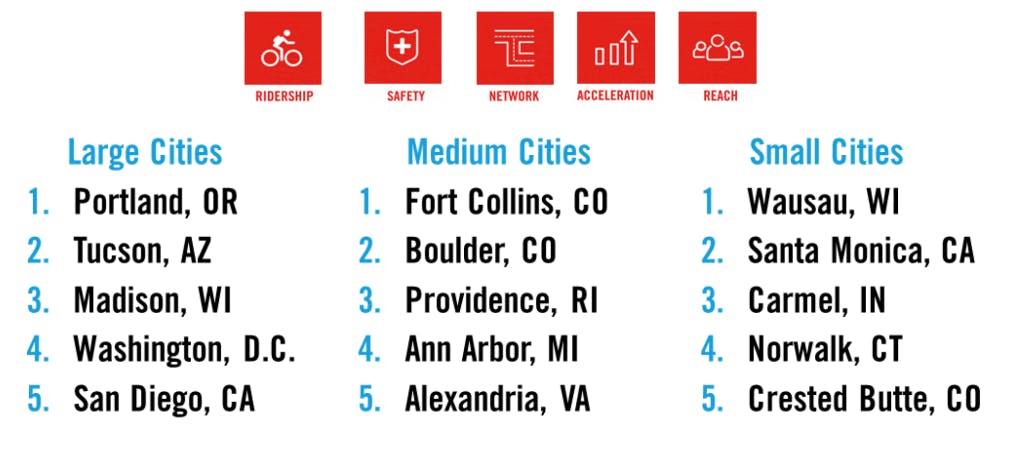
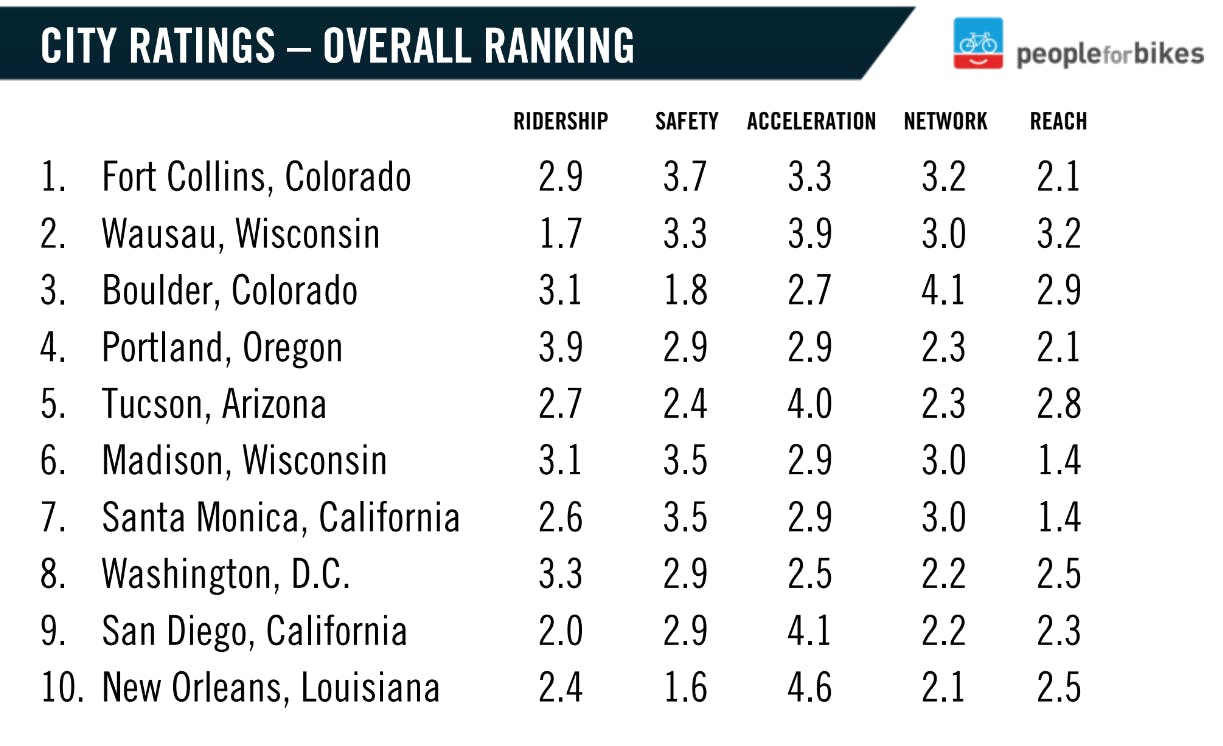
There are a lot of “best bike cities” lists out there, and if you ask us, that’s good. But the PlacesForBikes city rating system is the first of its kind in this country: transparent and fully data-driven, so any community can look directly at its strengths and weaknesses and know how to improve.
In theory, the PlacesForBikes system can even put a number on the impact of any single bike lane.
One other thing: It rewards cities not just for what they did 20 years ago, but also what they’re doing right now. As a result, these ratings will change. Cities will move both up and down.
“What gets measured gets done,” said PeopleForBikes Research Director Jennifer Boldry, Ph.D., who’s spent three years developing the rating system. “I would love if this were a tool for cities to measure where they are and track their progress.”
Measuring more than infrastructure
Street design is an essential ingredient of great biking, but it’s not the whole recipe. A great bike town has inclusive social rides like Bike Party or Slow Roll. It has public officials working to quickly make biking better, especially in disinvested areas. It has places you want to ride for fun, not just for practicality.
No system could perfectly capture every aspect of making a place great for biking. But ours combines a lot:
- Street-level data from Open Street Map on infrastructure, traffic speed limits, where people live, whether the low-stress bike network actually links them to destinations and how equitably infrastructure is available to disadvantaged groups (31%)
- Local and federal data on the overall traffic injury rates, both for people biking and people using any mode (16%)
- The scale and variety of investment in bike infrastructure and events reported by local officials for the PlacesForBikes City Snapshot (16%)
- The PlacesForBikes Community Survey, which asked 39,076 people (with certain minimum figures per city rated) about their riding habits and perceptions of safety and progress (16%)
- Census American Community Survey data on the local percentage and gender split of bike commuters compared to car commuters (13%)
- An assessment of a community’s propensity to bike for fun, from Sports Marketing Surveys (8%)
When she and her colleagues were concocting this cocktail of ways to track good biking, Boldry said, they tried to focus on making the findings “actionable” for local officials and advocates.
“What’s the measure that is comparable city to city, and when we put the different measures together kind of gives us a balanced picture of what success looks like?” she said. “It was difficult because the data sets available and we all know and talk about, the ACS mode share data and the FARS fatality data, are such a limited view of what success looks like. The real challenge was what do we create to fill in the gaps.”
That was the origin of the PlacesForBikes Bicycle Network Analysis, which launched last year and assigns a score specifically to the low-stress biking networks in hundreds of U.S. cities. It’s the origin of just under one-third of a city’s PlacesForBikes rating.
“That’s probably the new data source that I’m most excited about,” Boldry said.
A groundbreaking new way to measure ridership
One big innovation in the PlacesForBikes ratings is worth lingering on. Instead of comparing bike commuting rates the simplest possible way — the percentage of workers who live within city limits who report commuting mostly by bike on a random week — it introduces a much smarter way to weigh commuting rates against each other.
It’s the brainchild of Nathan Wilkes, a street designer and planner in Austin, Tex., who developed this method as a better way to track his own city’s progress.
First, the method doesn’t penalize cities like New York or Boston for having lots of transit or foot commuting. Instead of measuring bike commuters as a share of all commuters, it compares bike commuters to the number of car commuters.
Second, the method doesn’t penalize cities like Indianapolis or Tucson for having far-flung city limits that happen to include suburban-style neighborhoods.
“It came to me working in Austin for years,” Wilkes said. “For a large city, the best way to increase your mode share would be to de-annex.”
Wilkes’s alternative, which we’ve used in these ratings, starts from the assumption that every city has a biking core — and the further people live from it, the less likely they are to bike. According to tract-level data in the American Community Survey, that’s more or less true.
“I compiled ACS for every Census tract in the entire country,” Wilkes said. “And when you look at the cumulative mode share from the highest bicycle mode shares to the lowest mode shares in every single city, every single city has a remarkably similar decay.”
But in the best bike cities, distance from the “biking core” matters less. We score cities not only by how much biking there is their core, but also how much biking there is one mile away, two miles away and so on. This removes city borders as a factor.
“You can essentially compare how that city is performing at each of those slices when compared to the idealized city,” Wilkes said.
A rating system designed to be used
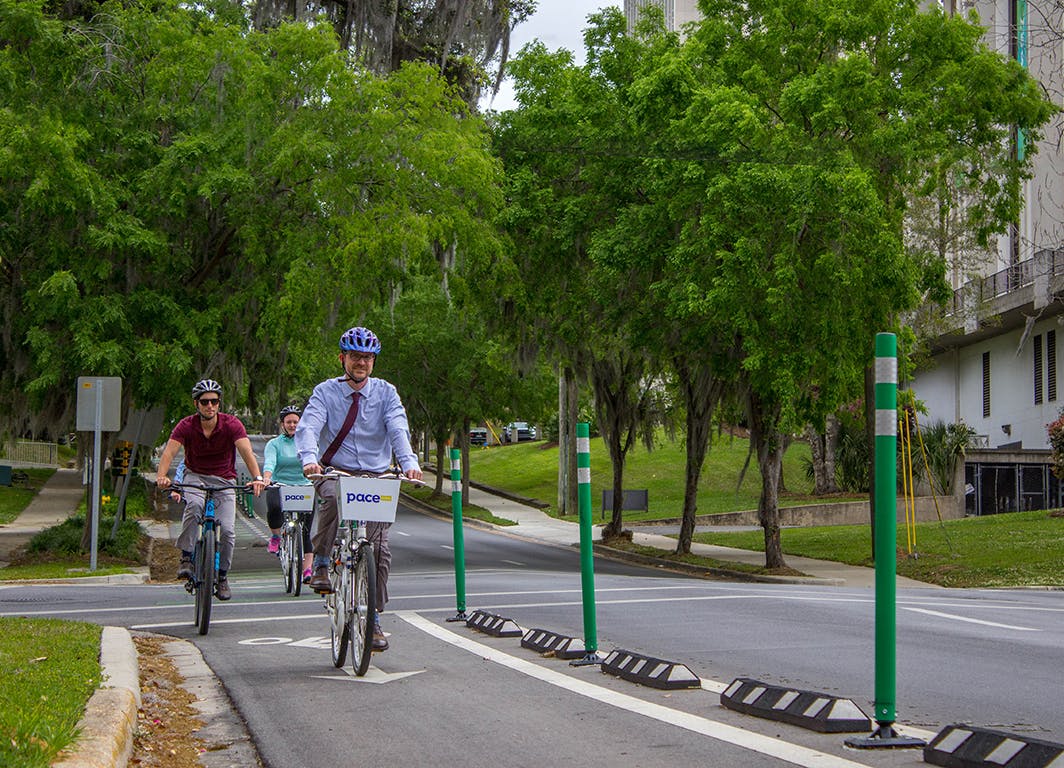
If the PlacesForBikes rating system has been designed for anyone, it’s for people like Julie Christensen.
“We have about $1.5 million dollars per year here in Tallahassee allocated in the next 20 years for bike improvements,” said Christensen, a senior planner in Florida’s capital city. “I really think it’s going to show us where connections are lacking and identify areas for investment and improvement.”
Durham, N.C., pedestrian and bicycle coordinator Dale McKeel said he’s hoping the system will help Durham track itself against the cities it competes with for jobs and migrants.
“I think it will help us measure the quality of our network and see how we’re doing compared to some of our peer cities,” he said.
In Ferndale, Mich., a close-in suburb of Detroit that covers just four square miles of land, planning manager Justin Lyons said it’s hard to track the success of bike network investments simply by counting bikes, because so many trips cross into neighboring jurisdictions.
“We’re much smaller than a lot of cities that are making these types of investments,” said Lyons. “Measuring the impact of everything we do to the city is a little bit tough to track.”
The PlacesForBikes system, he said, could help with that.
Tim Blumenthal, president of PeopleForBikes, said he expects the new rating system to evolve and to keep incorporating better data as years go by.
He also wanted to acknowledge something else: The fact that in this five-star rating system, not a single U.S. city has currently earned more than three.
“We’re grading, ultimately, on a global scale — we’re not giving five stars or As to cities that aren’t consistently appealing for anybody who wants to ride a bike,” he said. “And the truth is that there aren’t any U.S. cities that consistently meet those criteria. And as much as it might hurt not to have any superstars, that’s honest.”
Related Topics:
Related Locations:
